Markets
The Numbers Behind the World’s Closest Trade Relationship

Numbers Behind the World’s Closest Trade Relationship
Whether we’re discussing the ancient merchants that traversed the legendary Silk Road, or the transfer of goods across modern border lines, trade has always been about building close relationships.
There are many examples of strong and mutually-beneficial trade relationships all throughout history, but one doesn’t have to look far back to find what could be considered the closest bilateral relationship ever known: the one between the United States and Canada.
These two countries are each other’s best customers, and they share the world’s longest international border (5,525 miles long). They are both Western democracies with shared cultural heritage and similar standards of living – and each day, the two countries exchange a whopping US$1.7 billion in goods and services.
Our infographic today highlights numbers and tangible examples behind this lengthy relationship between the U.S. and Canada.
America’s Best Customer
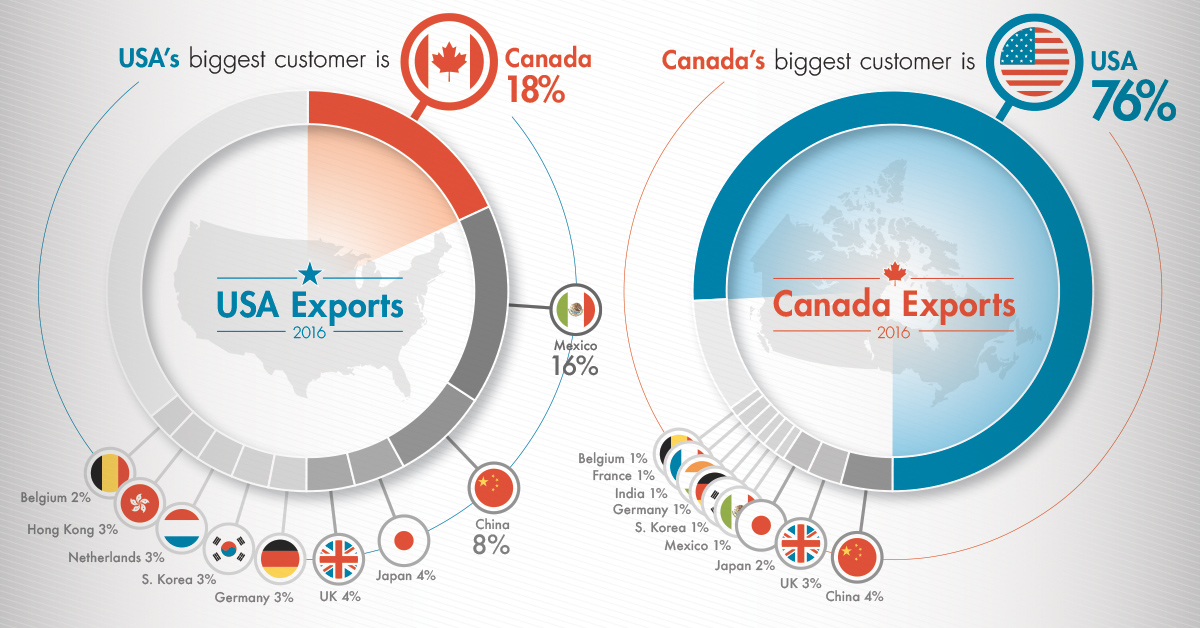
Despite China surpassing Canada in 2015 to become America’s largest trading partner in aggregate, the majority of Chinese trade comes in the form of imports ($462B imports vs. $115B exports). That means China is actually only the third-largest customer of American-made goods, buying about 8% of total U.S. exports in 2016.
The largest buyer of American goods is still north of the border – in fact, Canadians buy about 18% of total U.S. exports, which is more than twice that of China.
Here’s what Canada buys from the U.S.:
| Rank | Goods | Value ($US) |
|---|---|---|
| #1 | Vehicles & Auto Parts | $48.1 billion |
| #2 | Machinery | $40.0 billion |
| #3 | Electronic equipment | $23.9 billion |
| #4 | Mineral fuels including oil | $15.5 billion |
| #5 | Plastics | $12.3 billion |
| #6 | Live trees and plants | $9.0 billion |
| #7 | Medical, technical equipment | $8.1 billion |
| #8 | Aircraft, spacecraft | $7.4 billion |
| #9 | Iron or steel products | $5.5 billion |
| #10 | Furniture, lighting, signs | $4.9 billion |
Canada is the most important international customer for 36 states – and every day the equivalent trade of all U.S./Japan happens over just one bridge (Ambassador Bridge) between Detroit, MI and Windsor, ON.
Canada’s Best Customer
Americans return the favor in a big way: an incredible 76% of Canadian exports are bought by Americans.
Here’s what the U.S. buys from Canada:
| Rank | Goods | Value ($US) |
|---|---|---|
| #1 | Vehicles & Auto Parts | $60.1 billion |
| #2 | Mineral fuels including oil | $57.6 billion |
| #3 | Machinery | $22.3 billion |
| #4 | Live trees and plants | $18.9 billion |
| #5 | Plastics | $10.9 billion |
| #6 | Wood | $10.1 billion |
| #7 | Electronic equipment | $9.4 billion |
| #8 | Gems, precious metals | $7.3 billion |
| #9 | Aluminum | $7.0 billion |
| #10 | Paper | $6.1 billion |
It’s estimated that 78% of Canadian exports to the U.S. are raw materials, parts and components, and services used to create other goods in the United States.
Close Ties
Through many years of trade, the supply chains between the two countries have become highly integrated.
Much of the time, the U.S. is buying raw materials and intermediate goods, which get used in final products destined for domestic and global markets. Many of those even get sold directly back to Canada.
This could be buying Canadian crude to reduce reliance on OPEC, importing low cost hydro electricity during times of heavy rainfall, or using Canada’s steady supply of aluminum to make more environmentally sound vehicles.
Few countries in the world have this kind of economic interdependence – and the history, integration, and value of goods traded makes this arguably the world’s closest bilateral trade relationship.


Investor Education
How MSCI Builds Thematic Indexes: A Step-by-Step Guide
From developing an index objective to choosing relevant stocks, this graphic breaks down how MSCI builds thematic indexes using examples.


How MSCI Builds Thematic Indexes: A Step-by-Step Guide
Have you ever wondered how MSCI builds its thematic indexes?
To capture long-term, structural trends that could drive business performance in the future, the company follows a systematic approach. This graphic from MSCI breaks down each step in the process used to create its thematic indexes.
Step 1: Develop an Index Objective
MSCI first builds a broad statement of what the theme aims to capture based on extensive research and insights from industry experts.
Steps 2 and 3: List Sub-Themes, Generate Keyword List
Together with experts, MSCI creates a list of sub-themes or “seedwords” to identify aligned business activities.
The team then assembles a collection of suitable documents describing the theme. Natural language processing efficiently analyzes word frequency and relevance to generate a more detailed set of keywords contextually similar to the seedwords.
Step 4: Find Relevant Companies
By analyzing financial reports, MSCI picks companies relevant to the theme using two methods:
- Direct approach: Revenue from a company’s business segment is considered 100% relevant if the segment name matches a theme keyword. Standard Industrial Classification (SIC) codes from these directly-matched segments make up the eligible SIC code list used in the indirect approach.
- Indirect approach: If a segment name doesn’t match theme keywords, MSCI will:
- Analyze the density of theme keywords mentioned in the company’s description. A minimum of two unique keywords is required.
- The keyword density determines a “discount factor” to reflect lower certainty in theme alignment.
- Revenue from business segments with an eligible SIC code, regardless of how they are named, is scaled down by the discount factor.
The total percentage of revenue applicable to the theme from both approaches determines a company’s relevance score.
Step 5: Select the Stocks
Finally, MSCI narrows down the stocks that will be included:
- Global parent universe: The ACWI Investable Market Index (IMI) is the starting point for standard thematic indexes.
- Relevance filter: The universe is filtered for companies with a relevance score of at least 25%.
- False positive control: Eligible companies that are mapped to un-related GICS sub-industries are removed.
Companies with higher relevance scores and market caps have a higher weighting in the index, with the maximum weighting for any one issuer capped at 5%. The final selected stocks span various sectors.
MSCI Thematic Indexes: Regularly Updated and Rules-Based
Once an index is built, it is reviewed semi-annually and updated based on:
- Changes to the parent index
- Changes at individual companies
- Theme developments based on expert input
Theme keywords are reviewed yearly in May. Overall, MSCI’s thematic index construction process is objective, scalable, and flexible. The process can be customized based on the theme(s) you want to capture.
Learn more about MSCI’s thematic indexes.

-

 Investor Education5 months ago
The 20 Most Common Investing Mistakes, in One Chart
Here are the most common investing mistakes to avoid, from emotionally-driven investing to paying too much in fees.
-

 Stocks10 months ago
Visualizing BlackRock’s Top Equity Holdings
BlackRock is the world’s largest asset manager, with over $9 trillion in holdings. Here are the company’s top equity holdings.
-

 Investor Education10 months ago
10-Year Annualized Forecasts for Major Asset Classes
This infographic visualizes 10-year annualized forecasts for both equities and fixed income using data from Vanguard.
-

 Investor Education1 year ago
Visualizing 90 Years of Stock and Bond Portfolio Performance
How have investment returns for different portfolio allocations of stocks and bonds compared over the last 90 years?
-

 Debt2 years ago
Countries with the Highest Default Risk in 2022
In this infographic, we examine new data that ranks the top 25 countries by their default risk.
-

 Markets2 years ago
The Best Months for Stock Market Gains
This infographic analyzes over 30 years of stock market performance to identify the best and worst months for gains.


-
 Money2 weeks ago
Visualizing the Growth of $100, by Asset Class (1970-2023)
-

 Money1 week ago
Where Does One U.S. Tax Dollar Go?
-

 Green2 weeks ago
Ranked: Top Countries by Total Forest Loss Since 2001
-

 Real Estate2 weeks ago
Visualizing America’s Shortage of Affordable Homes
-

 Maps2 weeks ago
Mapped: Average Wages Across Europe
-

 Mining2 weeks ago
Charted: The Value Gap Between the Gold Price and Gold Miners
-

 Demographics2 weeks ago
Visualizing the Size of the Global Senior Population
-

 Automotive2 weeks ago
Tesla Is Once Again the World’s Best-Selling EV Company